Add to the grim numbers below these best estimates of Oil Depletion
The worst case scenario is that PEAK OIL has already passed
and by 2025/30 the world will be getting along with 33% less oil for a rapidly
increasing demand. That is only 12 to 17 years away. This clearly
indicates steadily rising prices in the cost of Oil.
What is that going to do to us economically?
What is it going to do given the already terrible numbers
above? Add to the grim numbers above the best estimates of Oil Depletion
All experts agree that world oil production will peak
before the year 2015. What happens then?
Future Shortages—Rising worldwide demand for oil
will collide with falling availability. Governments, corporations, and
individuals will compete for that shrinking supply. The oil industry directly
controls a sixth of the world’s economy. More than 25 percent of ship traffic
on the world’s oceans is carrying oil; thousands of huge tankers churn through
the waters night and day. Diesel-burning trucks carry 70 percent of U.S.
products. Petro-burning planes, trains, and ships carry the rest. So prices of
just about everything will rise, because just about everything has a fossil
fuel energy component in its pricing. And, since petroleum energy is used to
produce oil, whenever the selling price of oil rises, the cost of producing oil
will also rise, possibly triggering another rise in the selling price of oil.
The assumption that we will simply pay more for the same
amount of fuel is naive. Year after year, once this process starts, more and
more people must manage with less and less fossil energy for heating, cooking,
driving, and generating electricity. Most fossil fuel supply experts project a
future in which world crude oil supply drops two to five percent per year,
starting the year after Hubbert’s worldwide peak. Here are some wild guesses as
to the timing and amount of future shortages. If it happens in 2005:
in 2015, the world’s economy must get along on 20% less oil;
by 2025, they must use 33% less;
by 2035, they make do with 50% less;
by 2045, 75% less; by 2060, 99% less.
If the peak happens in 2015:
by 2030, people must manage on 33% less oil;
in 2045, they have 50% less; in 2060, they have 75% less.
There is one potential delayer for this grim depletion
chronology afflicting conventional oil deposits: oil sand. There are huge
deposts of tar-sands oil in Alberta, Canada, and in the Orinoco belt of
Venzuela The oil potential in tar-sand is said to equal more than the entire
world’s original supply of regular crude. Facing the coming shortage, Shell,
Chevron, and companies from China, Israel, Japan, and Korea are investing in
extracting oil from tar sands. This type of oil is very difficult to extract,
requiring natural gas and other oil-derived stuff to get the stuff and to
process it into anything more sophisticated than asphalt. A new type of
refinery is necessary; for $2.5 billion such a refinery is being built in
Alberta. Although getting oil from tar sands consumes two-thirds of the energy
those sands ultimately yield, requires and then pollutes huge amounts of fresh
water, and releases six times as much carbon dioxide into the air as the
refining of conventional oil, the industry is turning in this direction. There
is enough oil in tar sands to extract for as long as centuries more, but
experts suggest that the rate of production cannot equal the present use of conventionally-extracted
crude. We can be sure that the price of fossil fuels will rise as more
challenging types of deposits are mined, at ever greater costs. The huge
deposits of “oil shale in Colorado are probably not going to help. The rock
called “oil shale” by promoters is not a real shale. It is organic marlstone.
There is no oil in it. It does contain a solid organic substance named kerogen.
The production of oil from kerogen currently requires mining, transport,
heating to 900 F., adding hydrogen, and disposing of waste. It takes huge
amounts of pure water, a substance scarcer in Colorado right now than oil. All
extraction and “refining” attempts so far, including recent efforts by Chevron,
Exxon, Occidental Petroleum, and Unocal, have failed.
We should not expect a sudden transition from great abundance to complete
exhaustion of these resources. Various more-gradual scenarios are more
plausible, as discussed below. However, the straight-line analysis presented in
reference 1 remains
useful, because (among other things) it sets the timescale on which
something big must happen.
There are various possible outcomes, all of which depend
on the interplay of various factors:
·
Causative factor A: Depletion of the super-low-priced
sources raises the market price.
·
Causative factor B: One could imagine taxation in
anticipation of future shortages, so as to raise the market price.
·
Causative factor C: The cost of warfare to secure
otherwise “cheap” oil raises the real cost. If we take the cost of the recent
wars, divided by the amount of oil imports, it imputes a modest increase in the
price per gallon. This is not large enough to greatly alter usage patterns. On
the other hand,
§
It is large enough to be noticeable. A trillion dollars
is nothing to sneeze at.
§
The next war might be more expensive.
§
The Iraq war has significantly reduced Iraq’s oil
production, contributing to upward pressure on prices. Various embargoes and
sanctions also tend to push prices up.
§
Wars contribute to instability throughout the region.
The overthrow of governments in somewhat-friendly producing nations could
greatly disrupt supplies.
§
Producing nations that are presently somewhat friendly
might come to disagree with US military policy, and could reduce production or
even organize a boycott. This has happened before: There was a boycott in 1967
and a more-effective boycott in 1973.
Any combination of factors (A,B,C) promote the following results (1,2,3,4):
1.
The most wasteful uses become unaffordable.
2.
Other uses continue at the higher price. For example, oil is a
feedstock for some chemical processes leading to “priceless” products. The
priceless uses of fossil resources will continue the longest.
3.
If you really have a priceless application for oil, you can
find renewable sources: corn, sunflower, whatever. Chemical processes can be
adapted to use less-than-ideal feedstocks. The price goes up, but the priceless
uses continue.
4.
Non-oil sources of power that are currently uncompetitive
(e.g. solar power plants) become commercially viable.
We should also consider the following:
·
Causative factor D: The cost of solar power plants
falls due to the march of technology. It should fall relatively quickly compared
to the more-mature fossil-fuel power technology. This further promotes result
#4. And high-volume deployment should accelerate the march of technology,
creating a positive-feedback loop.stimated versus
Proven Reserves
For a discussion of the various types of
estimates, see reference 2.
The main types are
·
proven reserves
·
probable reserves
·
possible reserves
Scientific calculations
should be done using the best available data. When it comes to estimating the
amount of oil on earth, the “proven reserves” are not the best data.
Also, the reserves at the
“current” time is not the most sensible way to approach the problem, because
that will change as a function of time due to consumption if nothing else.
Instead, it makes more sense to ask how much oil was on earth at a fixed epoch,
e.g. 1950 or 1980. Call this the endowment at
the specified epoch.
One would expect the proven
reserves to increase over time, as more “proof” becomes available. But this
does not mean the endowment is increasing. There is absolutely no reason to
think any significant amount of oil is being created.
So the sensible approach is
to establish a best estimate of the endowment. This estimate will be a
probability distribution, with some width around a central value. There is no
reason to expect the central value to change significantly as a function of time.
As more evidence accumulates over time, the width of the probability
distribution should decrease, and the central value will undergo a small random
walk, but the central value should not exhibit any systematic drift. (If the
central value does drift, it means you’ve been using unsound estimation
procedures. You should be embarrassed. Go back to square one and re-do
everything using sound estimation methods, so this problem never recurs.)
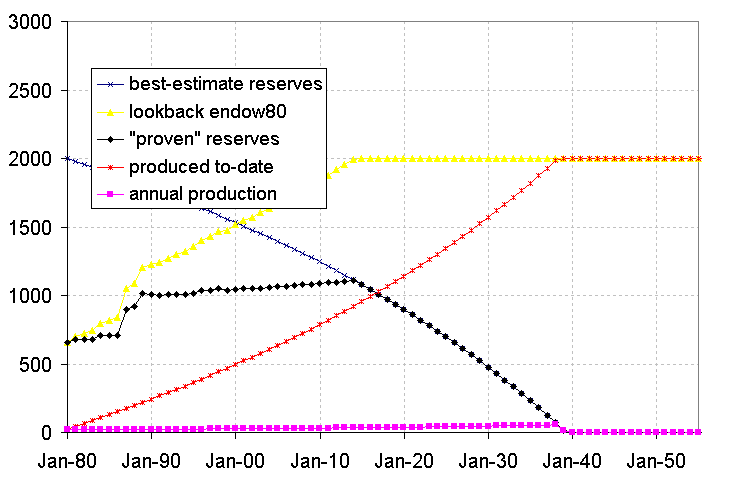
Figure 1 Oil Statistics Low Scenario
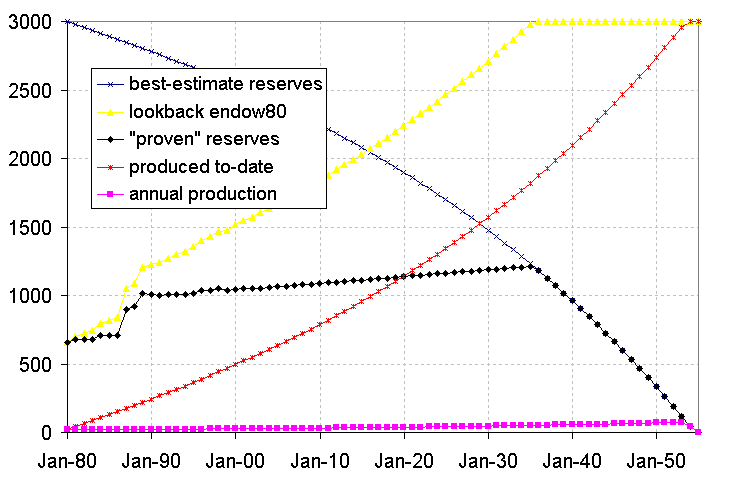
Figure 2: Oil
Statistics, High Scenario
We can use figure 1 and figure 2 to get
an idea of what might be going on. We do the analysis twice, because of the
uncertainty in the endowment. For a summary of reported estimates, see reference 3. Quite a
few authors favor a figure of about 2000 Gb (for the year 1980), although some
estimates run as high as 3000 Gb or slightly higher. It is not entirely clear
whether the disagreements stem from different interpretations of the same raw
data (for instance, different decisions as to whether to include oil that is
extremely hard to recover) or simply uncertainty in the raw data.
·
In these figures, the
abscissa is time, starting in 1980 and running through 2055. The ordinate is
gigabarrels of oil.
·
The magenta curve
hugging the bottom of the graph is the annual production rate. This uses data
from reference 4 up
to 2002, and then extrapolates assuming a 2% annual growth rate until the
resource is exhausted.
·
The red curve from lower
left to upper right is the total amount of oil produced since 1980. It is
calculated by integrating the magenta curve.
·
The smooth curve from upper
left to lower right is the best estimate of oil remaining in the world. It is
calculated by starting with an estimate of the endowment in 1980 and
subtracting the amount produced since then.
·
The black curve that is
relatively horizontal near the middle of the graph represents the “proven”
reserves. This uses data from reference 4 up to 2002, and then
extrapolates using a rather arbitrary slope of +5 Gb per year. However, the “proven”
reserves cannot possibly exceed the actual reserves, so some time soon, the
“proven” reserves must start decreasing. This happens around 2015 in the low
scenario, but not until 2035 in the high scenario.
A huge jump in these
“proven” reserves occurred in the late 1980s. This jump was not due to the
creation of new oil molecules, nor even the discovery of hitherto-unexplored
oil fields; instead it was a paperwork exercise carried out for political
reasons. During a period of slack demand, OPEC members wanted to increase their
claimed reserves in order to argue for larger OPEC production quotas.
·
Finally, the yellow
curve illustrates the fallacy of using the “proven” reserves as an estimate of
actual reserves. The yellow curve is a lame estimate of the amount of oil
existing in 1980, prepared by taking the “proven” reserves at time t and
adding the amount of oil produced between 1980 and time t. The fact
that this estimate changes as a function of t is proof that it
is bogus. The actual endowment of oil molecules existing in 1980 is a constant.
In the “low scenario” as
described in figure 1, in 1980
the earth had 2000 Gb of oil, of which only 1/3rd was classified as
“proven” reserves. In 2003, the world had 1530 Gb of oil, of which 2/3rds was
classified as “proven” reserves.
Despite the recent history
of increases in “proven” reserves, it would be quite foolish to attempt to
extrapolate such increases beyond the short-term future. Actual reserves are
going down, even if “proven” reserves are going up in the short term. Proven
reserves can never exceed 100% of actual reserves.
This section has analyzed
the “proven” reserves of oil in some detail, partly because the oil industry
seems so suffer the most from the “proven” reserves fallacy ... but similar
thoughts apply to the total energy endowment. Coal will last longer than oil,
but not a lot longer.
And as discussed in section 1, we do not
actually expect current trends to continue until reserves crash to zero; we
expect people to wise up and change their behavior before then.
We can predict with high
confidence that something big
will happen to overall energy usage in the next 75 years or less, and something
big will happen to oil usage in the next 40 to 50 years or less. We cannot
predict exactly what will happen, because the details depend on choices that
have yet to be made.
The world is much closer to running
out of oil than
official estimates admit, according to a whistleblower at the International
Energy Agency who claims it has been deliberately underplaying a looming
shortage for fear of triggering panic buying.
The amount of proven oil
reserves awaiting to be exploited fell last year for the first time in a
decade, according to the BP figures. The amount of crude left in the ground was
1.258trn barrels - 3bn less than last year.
These figures, revealed in
the BP
Statistical Review of World Energy, are probably the result of a
slump in drilling activity due to a fall in the price of oil last year - from
$150 per barrel to $30.
At today’s rate of use
however there is still enough oil to last the next 42 years, according to the
oil company although those concerned about Peak Oil say we are closer to
running out given demand is expected to rise strongly in the short-term.
BP’s Statistical Review is
used extensively by OPEC and others in the industry as a key text. This year’s
review shows coal consumption continuing to soar, especially in China, a 70%
year-on-year increase in solar capacity and contains a host of other energy
gems.
SO BP SAYS WE HAVE 42 YEARS BUT THEY ARE AN OIL COMPANY and may be being
conservative in their estimates - what if it’s closer to 30 years?
They seem to be banking on reduced consumption due to emerging countries like
Brazil, China, India etc having some interest in providing alternative fuel
vehicles to an emerging middle class. But the US is still using 25% of the
world energy supply and we have to compete for oil with these countries
Some
point to the tar sands - already included in the BP reports
as an identified source and part of the global reserves but the cost in
greenhouse gasses to convert the bitumen to oil is horrendous - this trade off
is a serious matter for concern with the Canadians. Trading the health of the
planet for for money is less palatable for them than the right wingers in the
US.
It’s going to be interesting to see how this works out. Is BP right? Do we have
a 42 year supply? Or is their estimate too conservative - are there only 30
years left with declining supplies and increasing demand. Many on the right are
betting our childrens lives on it.
The oil companies have been
making record profits without copping to any scarcity haven’t they?
The truth of the matter is that they do have a significant handle on the oil
reserves left in the world and can predict with excellent reliability the
presence of oil in geological structures. They get better at it all the
time.
The consumption of barrels of oil per day is currently 100,000,000 in
2012 Current
reserves are calculated at 1,392,461,000,000 or 39 years worth at current consumption
That fits quite closely with BP’s 42 year estimate. Oil is such a profitable
business and so sophisticated in the exploration and production techniques that
it is difficult to argue with these numbers but one factor above all others
makes the numbers suspect.
OPEC countries are tied to producing as a percentage of reserves and OPEC
reserve reporting has seen a dramatic oddity - none of the OPEC countries have
been reporting a drop in their reserves despite pumping billions of barrels out
of the ground every year
“Most outside observers believe that the ‘official’
reserves of OPEC members are way overstated,” “Remember the last increase was
in response to the OPEC quota agreement which allowed members to sell oil in
proportion to their reserves - the bigger your reserves, the bigger your quota.”“There have been many scandals over the years from
people overstating reserves to make them look richer and more important than
they are,” added Whipple.“The biggest fuss I can recall was in Kuwait about
five years ago, when somebody leaked a secret government study that said Kuwait’s
reserves were less than half what they had been saying. After much fuss, the
government made the whole issue even more secret and refused to answer further
questions about the report.”Oil giant BP produces an annual statistical review
containing a spreadsheet that has reported world oil reserves back to 1980.
“I’ve tracked that review
for the world and for specific OPEC countries,” “Six countries account for more
than 80 per cent of OPEC oil; Saudi [Arabia], Kuwait, Iraq, Iran, United Arab
Emirates, and Venezuela, and all six of them jacked up their reserves by nearly
100 per cent between 1984 and 1988.” This was not based on anything but a need
to overstate to raise their output quotas for the current leaders who did not
care about anything but maximizing income NOW instead of later when they would
not be around to spend the money.
We all know that Saudi and other Arab princes are prolifigate spenders who
build massive palaces and overseas homes while first turning Dubai
into a skyscraper orgy that has fallen on hard timesas the
people drawn to the boom are leaving their Ferrari’s and Mercedes in airport
parking lots as they escape. Dubai once the heaven for the fabulously wealthy
has fallen already and the once wealthy palace owning Sheiks will soon be back
riding camels across a barren wasteland after squandering the greatest single
asset in history. Nobody should weep for them but what this portends for the
USA is another matter.
It is easy to see why the OPEC producers jack up their reserve reports so they
can continue to produce the same or greater levels of oil each year - but it’s
impossible to believe estimates that never drop the amount of reserves. For
this reason alone it should be suspected that the numbers are inflated
and not too conservative. Saudi
Arabia is a case in point - production has been declining
raising speculation about their reported reserves.
Washington fears Saudi Arabia
overestimated its oil reserves by as much as 40 percent and
the kingdom can’t keep enough oil flowing to control prices, U.S. diplomatic
cables obtained by WikiLeaks
This puts a hole in speculation that reserves are being under reported to
increase prices.
So what of this new Bakken reserve in ND and Canada -
will it be our savior?
Well read it for yourself but it seem likely that this reserve will provide all
the oil we need for one full year if we can overcome the obstacles to it’s
recovery. The cost in water and air pollution is quite staggering.
In summary there is a whole lot we do know and much of that is not very
encouraging. I hope you are right but the weight of intelligent and informed
consideration is heavily stacked against you. It seems to me that 42 years of
supply at current usage is the best there is and given a certain increase in
use and a very likely overstatement of the reserves that 30 years is more
likely at significant increases of costs for fuel and significant damage to the
environment.


 \
\


